Industry Overview
Digital & Trend reports
Overview and forecasts on trending topics
Industry & Market reports
Industry and market insights and forecasts
Companies & Products reports
Key figures and rankings about companies and products
Consumer & Brand reports
Consumer and brand insights and preferences in various industries
Politics & Society reports
Detailed information about political and social topics
Country & Region reports
All key figures about countries and regions
Market forecast and expert KPIs for 1000+ markets in 190+ countries & territories
Insights on consumer attitudes and behavior worldwide
Business information on 70m+ public and private companies
Explore Company Insights
Detailed information for 35,000+ online stores and marketplaces
Directly accessible data for 170 industries from 50 countries and over 1 million facts:
Customized Research & Analysis projects:
Get quick analyses with our professional research service
The best of the best: the portal for top lists & rankings:
Transforming Data into Design:
Statista Content & Design
Strategy and business building for the data-driven economy:
While the arrival and mass adoption of mobile phones was undoubtedly a pivotal moment in telecommunication history, the arrival of smartphones was arguably an even bigger leap, if measured by the impact on people’s everyday lives. In little more than a decade, smartphones have revolutionized the way we live, work and communicate, enabling us to stay connected with loved ones, access information, entertainment and countless services, or even run businesses from the palm of our hands.
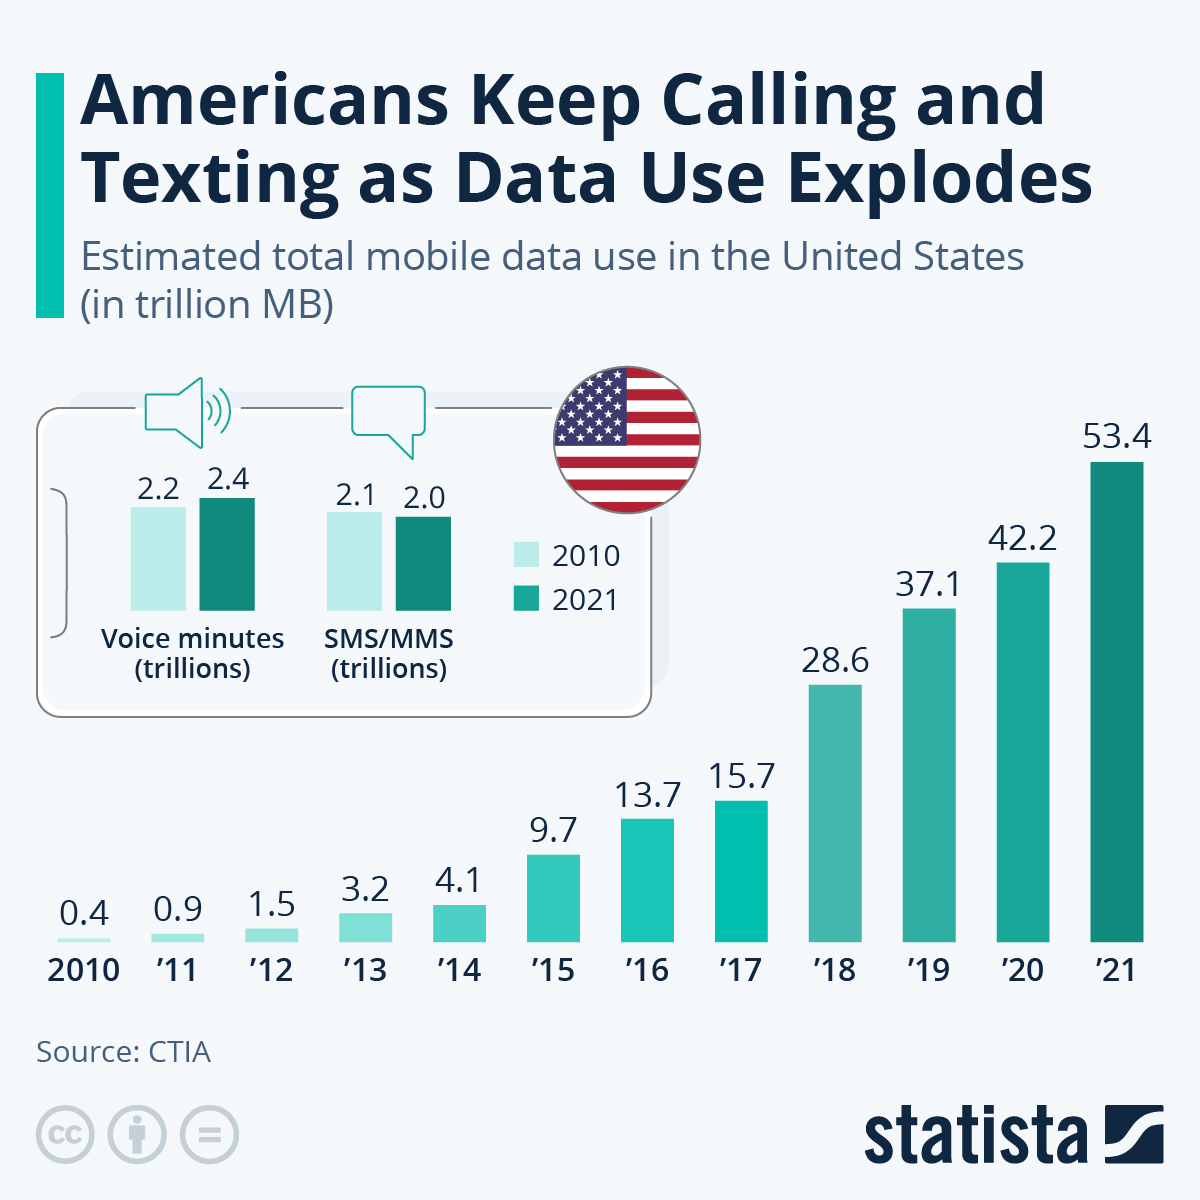
The rapid evolution of smartphone technology and mobile networks has made all this possible, as the speed of mobile broadband networks and the amount of data flowing through them has increased manyfold over the past decade. According to data from the CTIA, annual data consumption in the United States has grown almost 140-fold between 2010 and 2021, reaching 53.4 trillion megabytes that year.
Interestingly, the rise of mobile internet and app usage has had a relatively minor effect on voice traffic and SMS/MMS volume, which has barely moved since 2010. Voice minutes even increased from 2.2 trillion in 2010 to 2.4 trillion in 2021, although it must be said that there have been some fluctuations during that period. The same is true for SMS/MMS volume, which decreased slightly from 2.1 to 2.0 trillion over the same period.
Taking into account that the number of mobile subscriptions grew by roughly 25 percent between 2010 and 2021, there has been a slight decline in use of voice and messaging services, albeit not a pronounced as one could have expected. Even in the age of instant messengers, and internet-based voice and video calls, it seems that Americans keep calling and texting.
Description
This chart shows annual mobile data consumption, voice and SMS/MMS traffic in the United States.
Report
Can I integrate infographics into my blog or website?
Yes, Statista allows the easy integration of many infographics on other websites. Simply copy the HTML code that is shown for the relevant statistic in order to integrate it. Our standard is 660 pixels, but you can customize how the statistic is displayed to suit your site by setting the width and the display size. Please note that the code must be integrated into the HTML code (not only the text) for WordPress pages and other CMS sites.
Statista offers daily infographics about trending topics, covering:Economy & Finance, Politics & Society, Tech & Media, Health & Environment, Consumer, Sports and many more.
Feel free to contact us anytime using our contact form or visit our FAQ page.
Need infographics, animated videos, presentations, data research or social media charts?
More Information

